FeaturesMonitoring


A lightweight agent reports CPU, memory, disk, disk I/O and network every minute, with history. Each site shows its status code, response time and 30-day uptime.

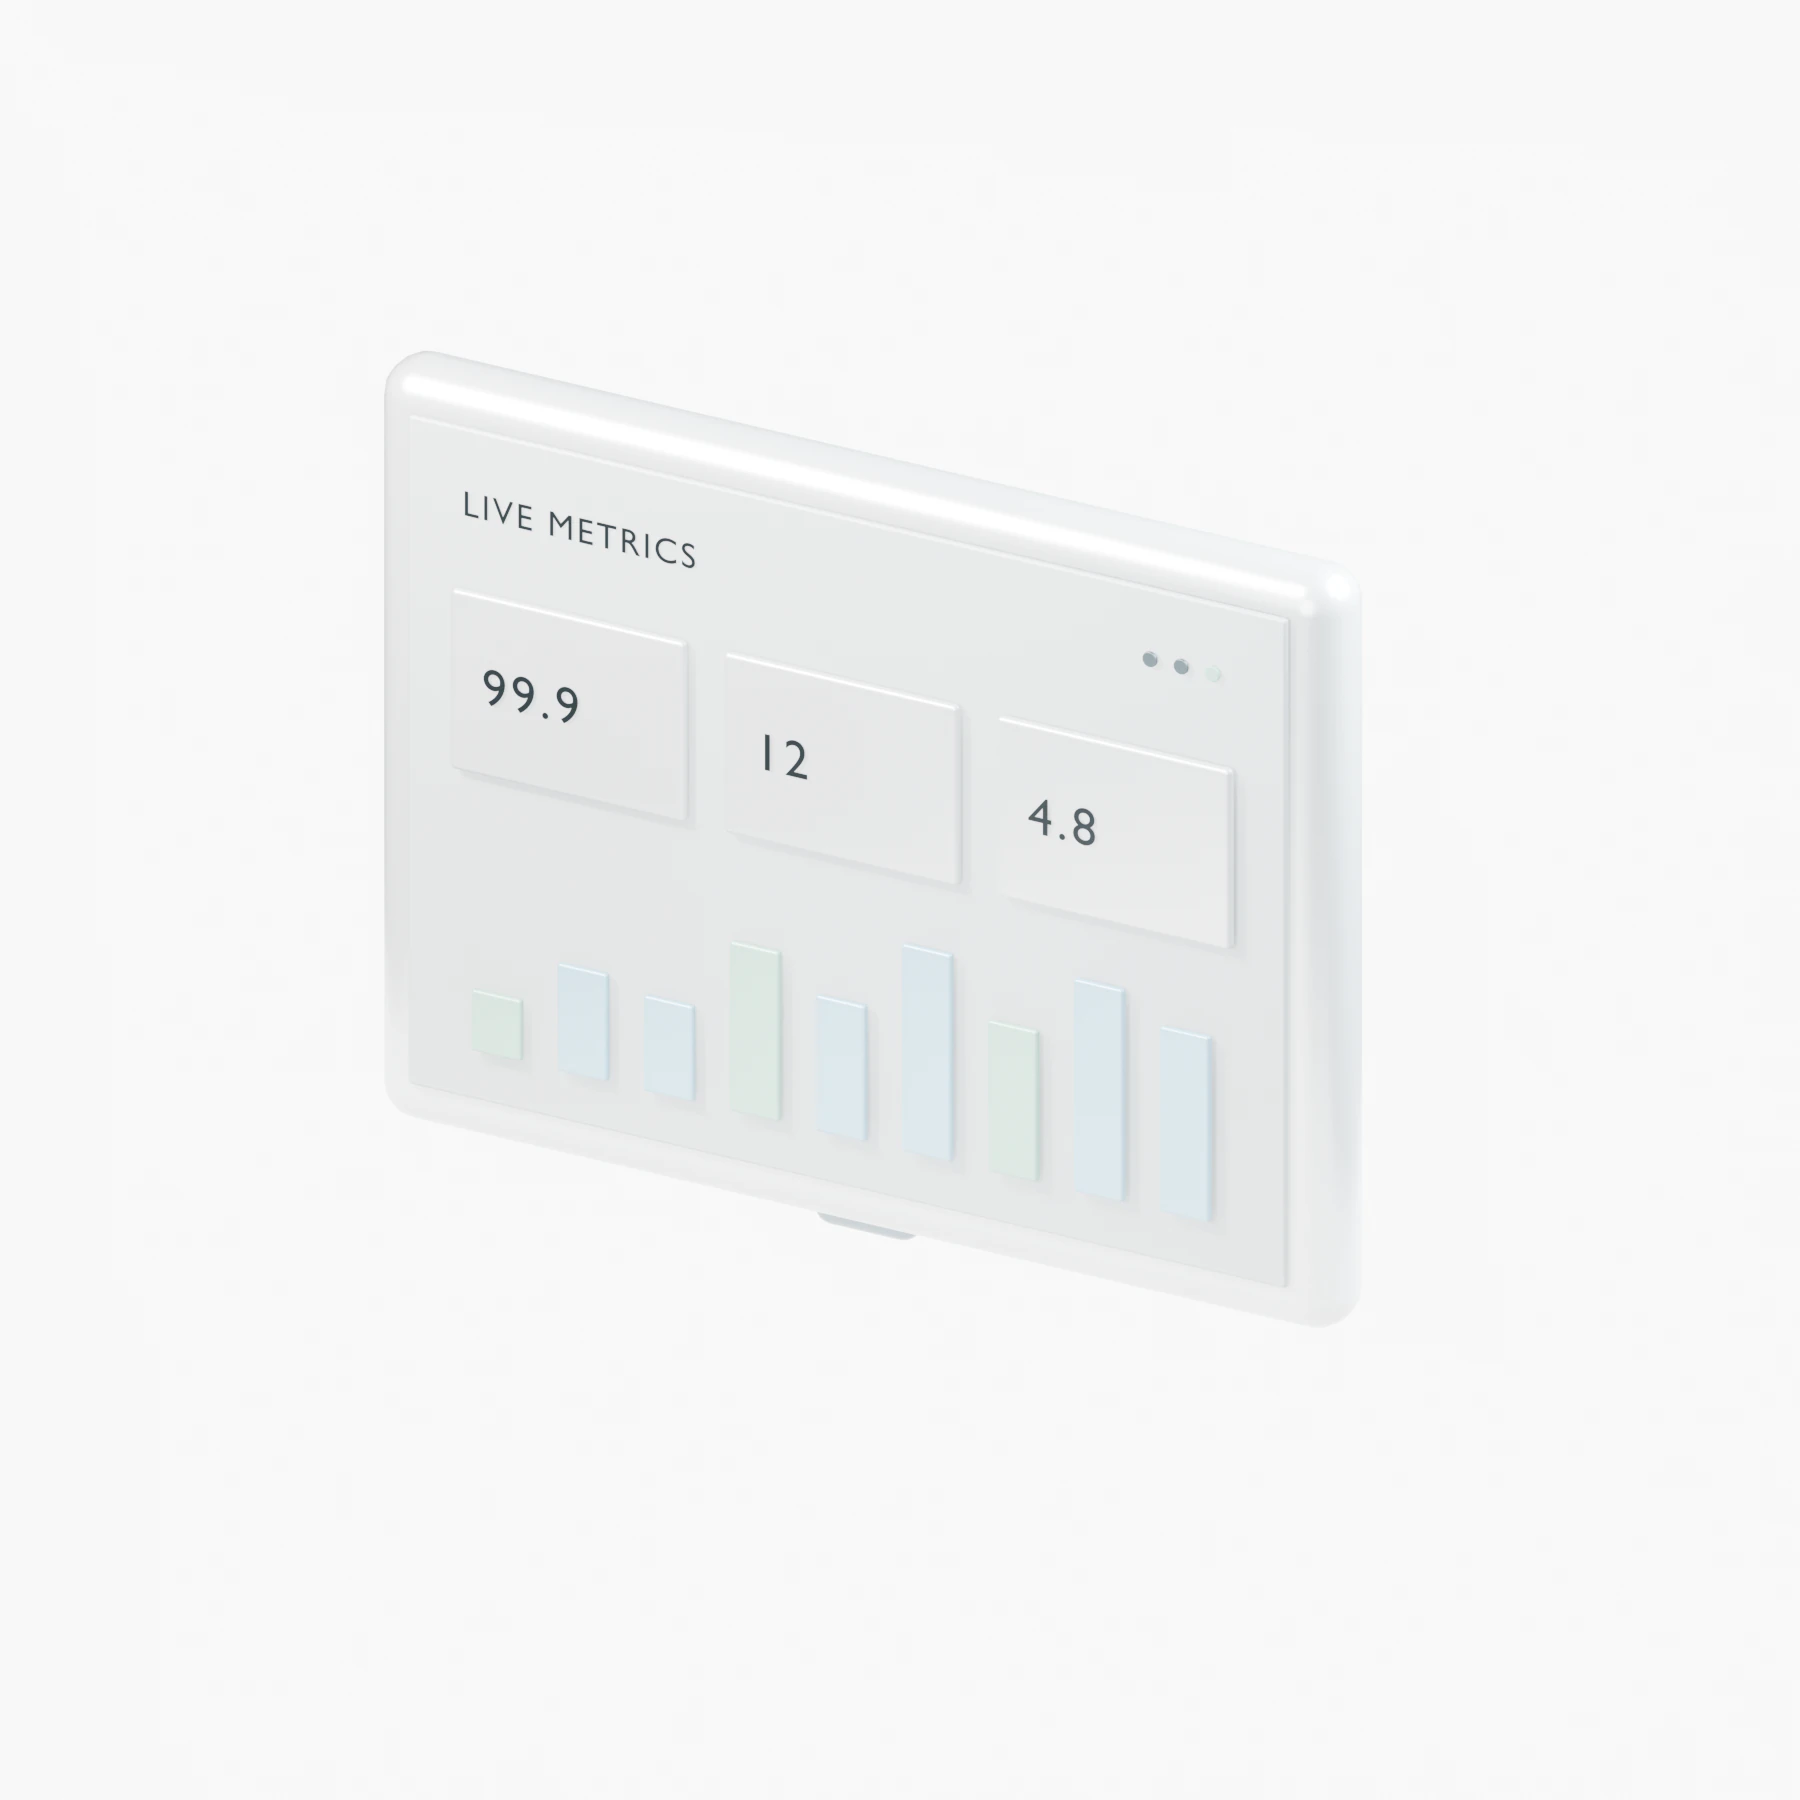
A machined control panel: LIVE METRICS

Switch metrics and ranges, then move across the chart to read a value.

27.9% cpu now · fsn-web-01
Five metrics
CPU, memory, disk, disk I/O and network per server.
A sample every minute
The agent sends a fresh sample about once a minute.
Uptime per site
Status code, response time and 30-day uptime on each site.
Alerts when a site goes down
An email and a dashboard notification after two failed checks, and another when the site is back. Also in Slack, Discord, Teams, Telegram or your own webhook.

Deploys, backups, scans and server events land in the activity log, filterable by type.

Activity

AllDeploysSecurityServer
  • Lena deployed slowclay.shopmain · 8f3c21a
  • Backup finished for hotel-linde.example1.84 GB to R2
  • Scan quarantined 2 files on hotel-linde.exampleSecurity
  • Jonas rolled back maisonoda.comto c41e07b
  • Lena created server fra-db-01Vultr · Frankfurt
  • Mira joined as DeveloperInvited by Lena

Do you send email or Slack alerts?

Both. When a site fails two checks in a row, the account owner gets an email and a notification in the dashboard, and another when it answers again. Add Slack, Discord, Microsoft Teams, Telegram or a signed webhook on the Notifications page to get site-down, failed deploy, failed backup and other alerts there, with a link back to Nuvlo. Team members can turn on email alerts for themselves.

How often is uptime checked?

Every 5 minutes for every active site, whether or not anyone has the dashboard open. Opening a site’s page adds a fresh check, at most every 30 seconds.


Your first server and site are free, with no card and no time limit. Connect a provider token and Nuvlo starts building it.