

Read server graphs
Follow a server's CPU, memory, disk and network use over the last hour, day or week, so you can spot a full disk or a busy server before it causes trouble.
On this page
Before you start
- A running server in Nuvlo. See Create a server.
Step 1 Open the Graphs tab
Open Servers, click the server and select the Graphs tab.
The server's Overview tab shows the same values live. This tab shows how they changed over time.
Step 2 Pick a time range
Choose Live, 1 hour, 12 hours, 24 hours or 1 week at the top right. All charts switch to that range.
Step 3 Read the charts
| Chart | What it shows |
|---|---|
| CPU usage | How busy the processor is, in percent. |
| RAM usage | How much memory is in use, in percent. |
| Disk usage | How full the disk is, in percent. |
| Disk throughput | How much data is read from and written to the disk. |
| Disk IOPS | How many read and write operations the disk handles. |
| Network traffic | Data coming in and going out. |
| Network packets per second | Packets coming in and going out. |
CPU or RAM that stays near 100% means the server is too small for its sites. You can resize the server. A disk that keeps filling up also shows as an alert on the Monitoring page once it passes 85%.
If the charts stay empty
The server reports its values through a small monitoring agent. If you see Collecting historical metrics, the first samples haven't arrived yet. Wait a few minutes, or click Refresh agent to reinstall the agent and reload the charts.
History is kept for one week. Values older than a day are shown as 15-minute averages.
Related guides
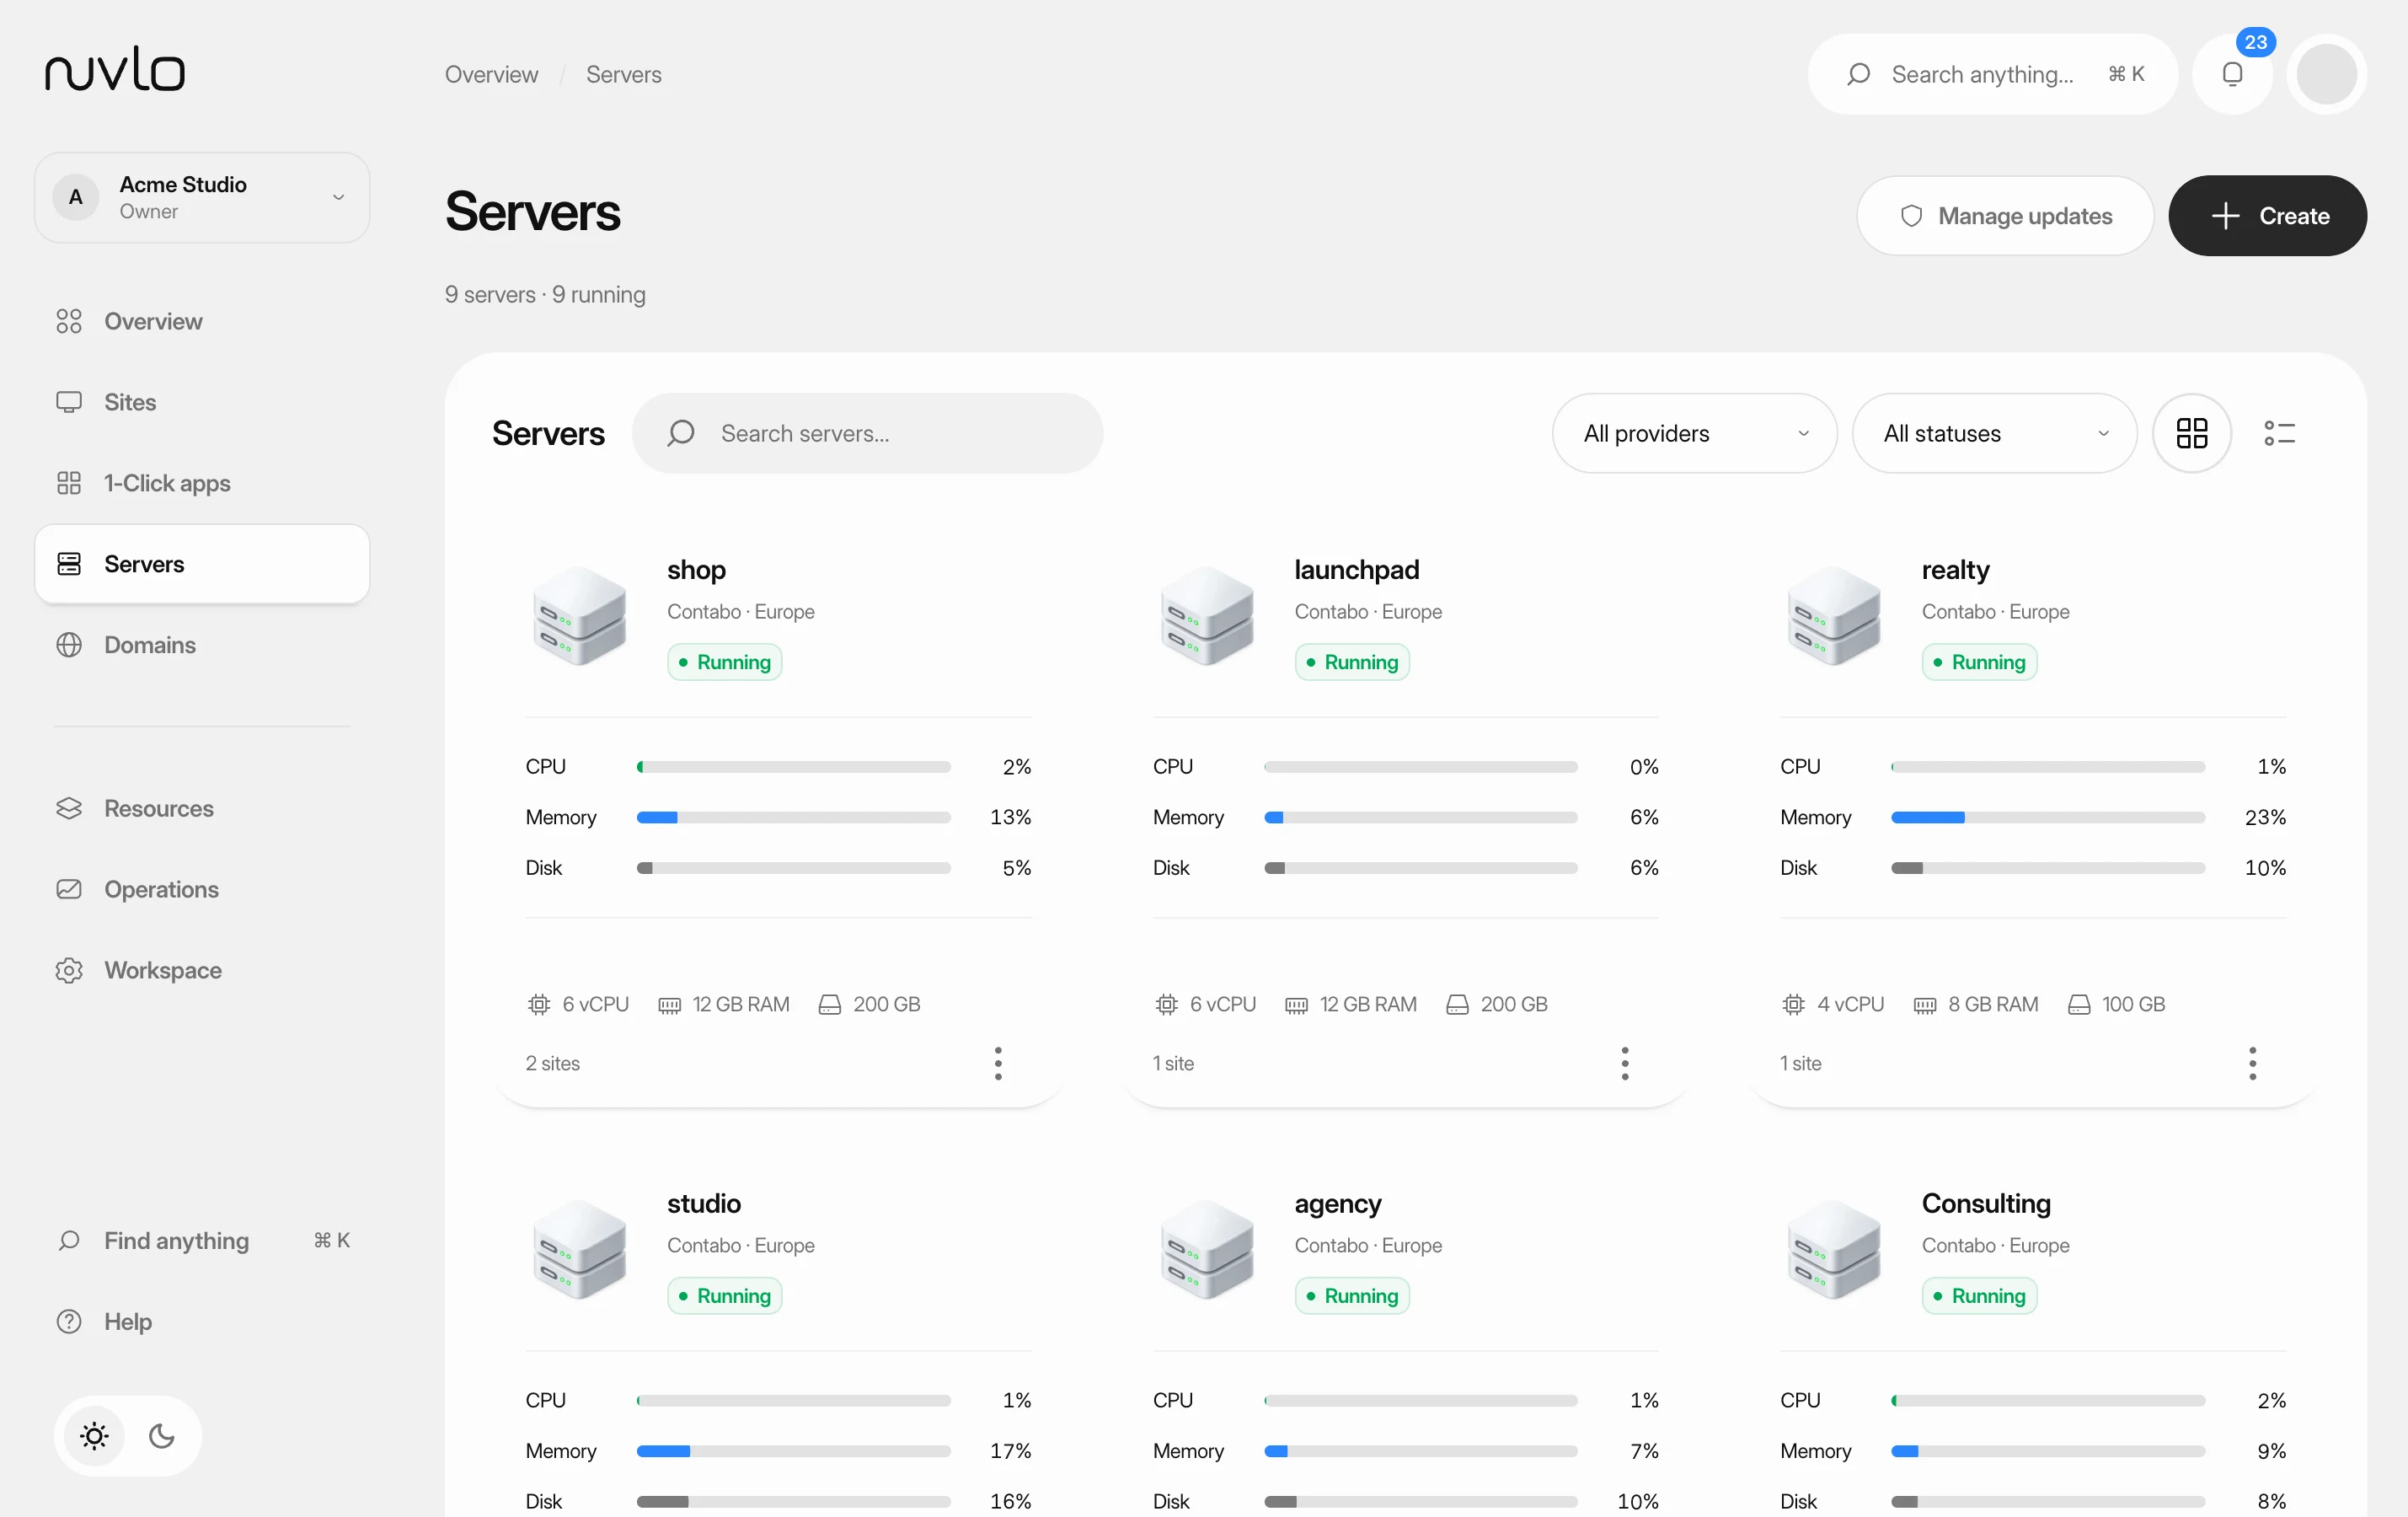 Read your server pageFind a server, check whether it's healthy, and know where each setting lives on its page.
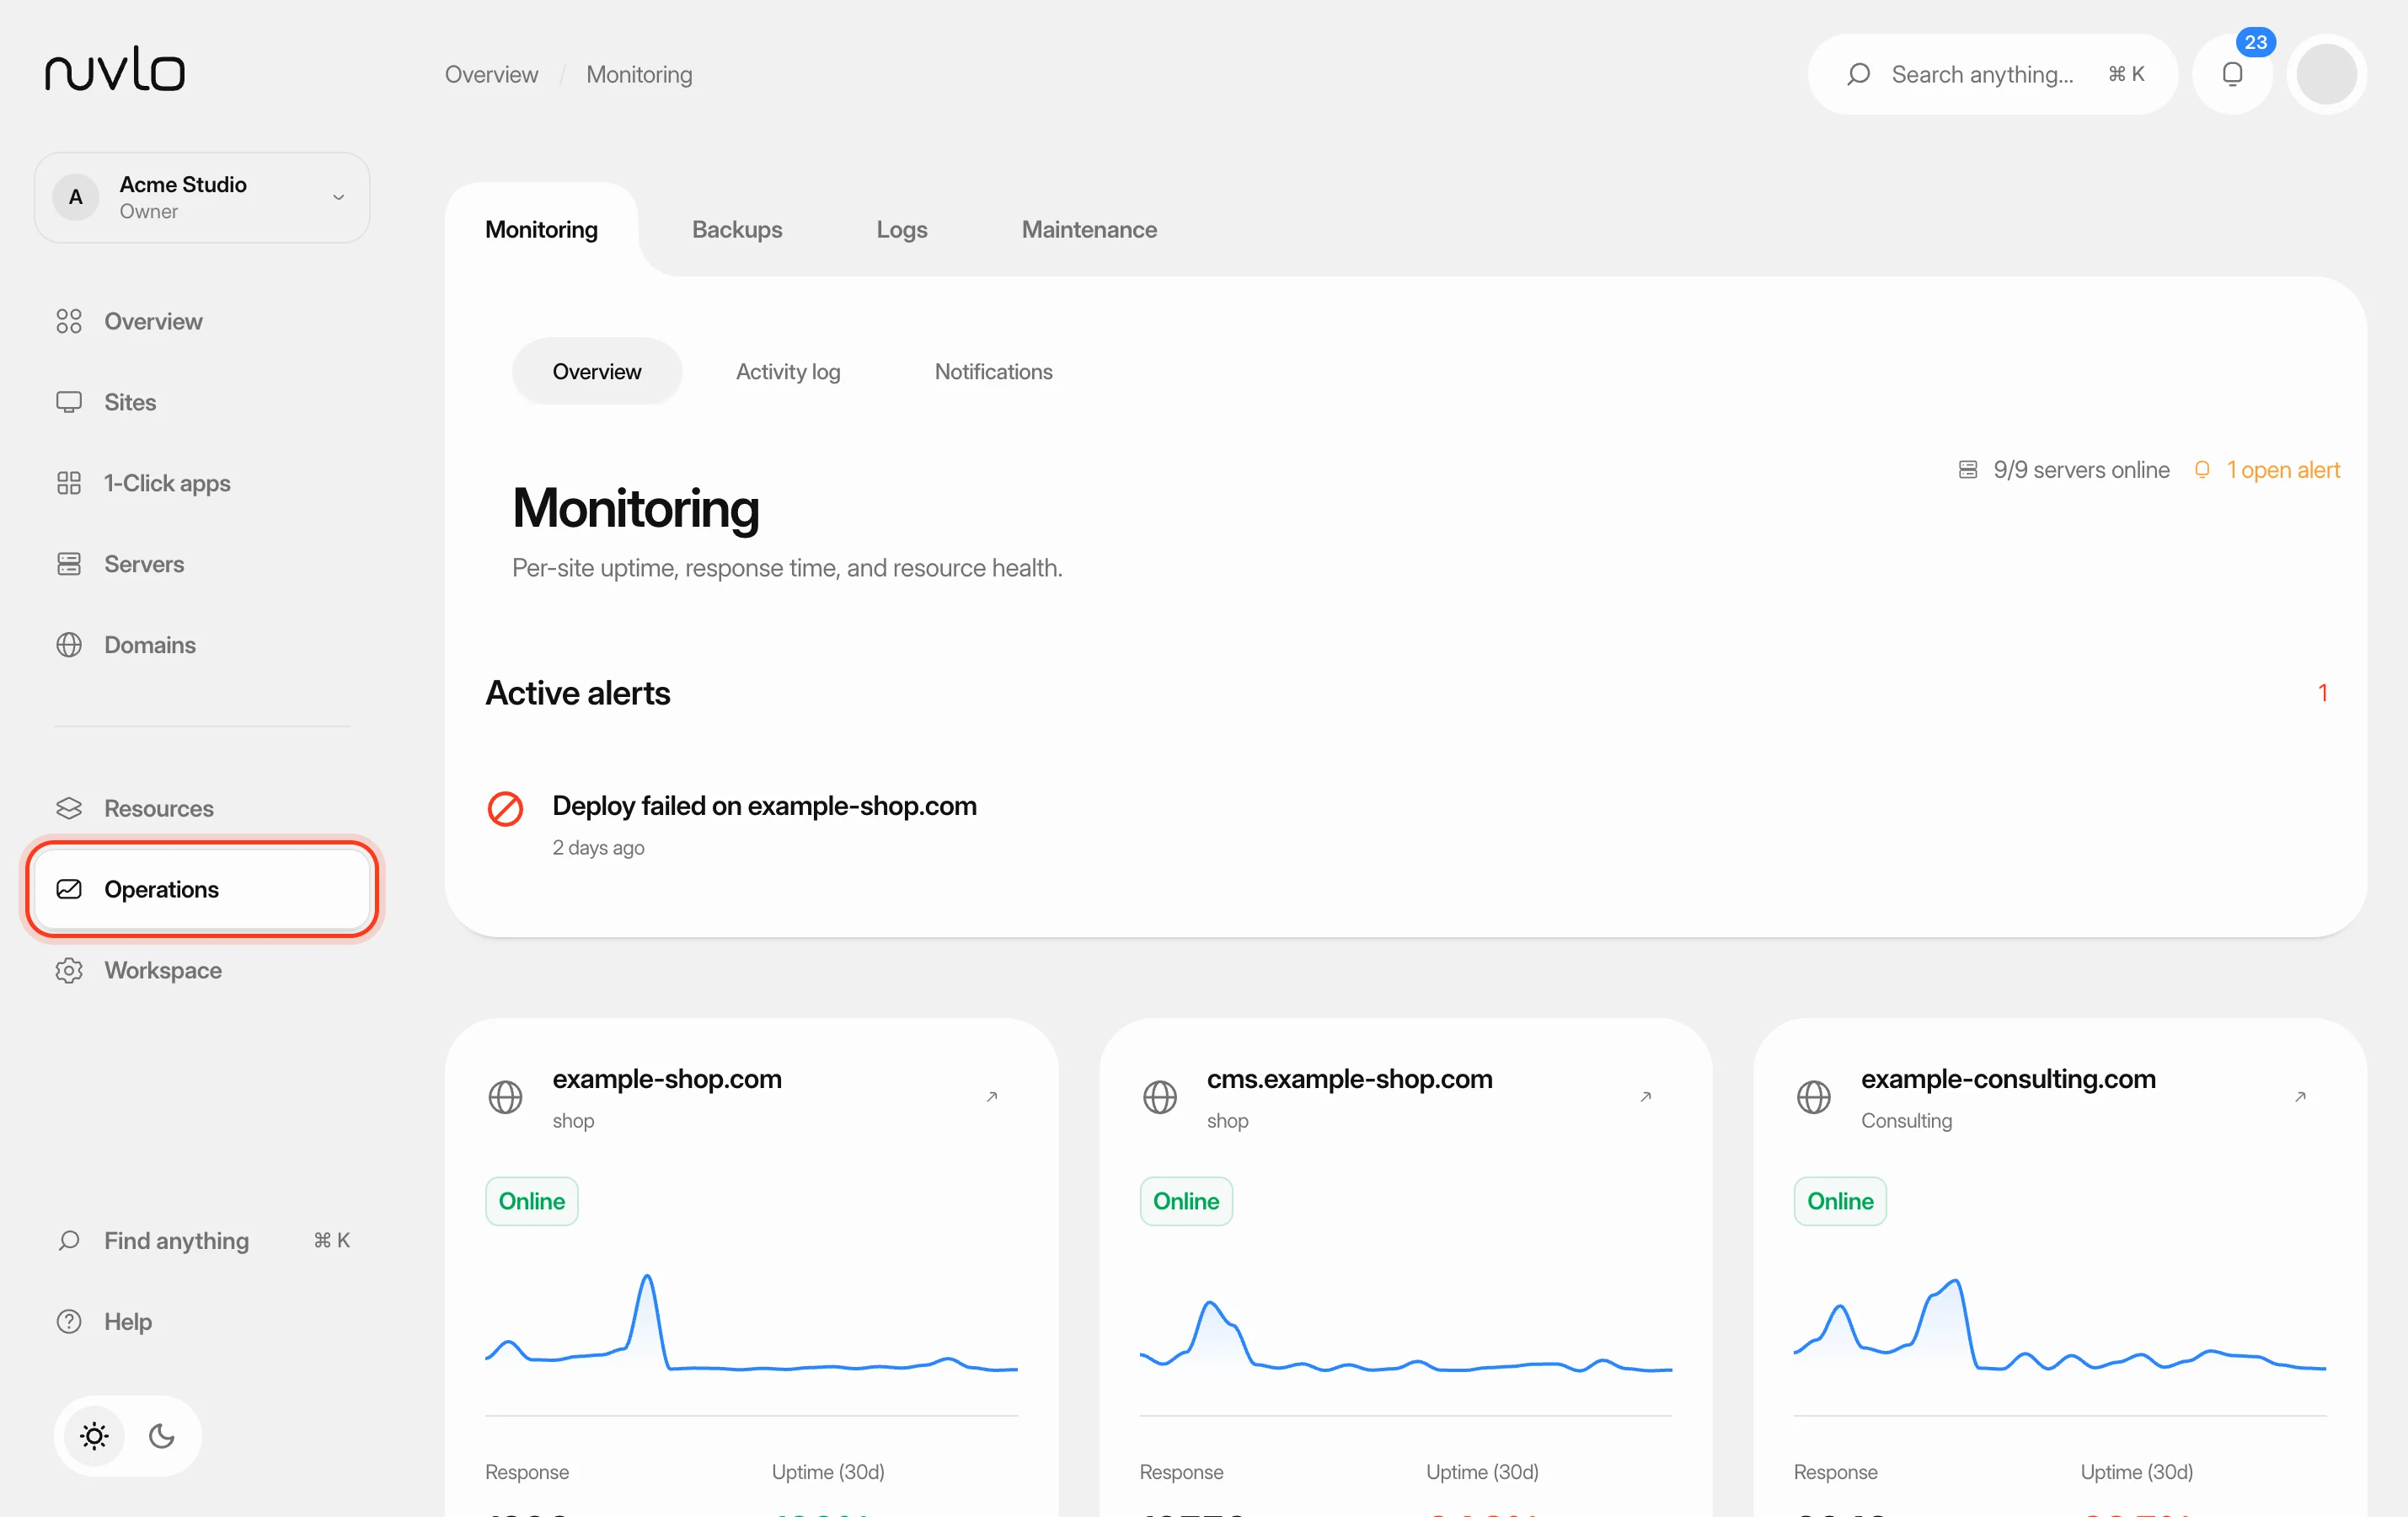 Monitor your sites and serversUse the Monitoring page to see which sites are up, how fast they answer and which problems need your attention, then drill into a single site or server.
 Change a server's planMove a server to a bigger or smaller plan at your provider, with more or less CPU, memory and disk, without leaving Nuvlo.
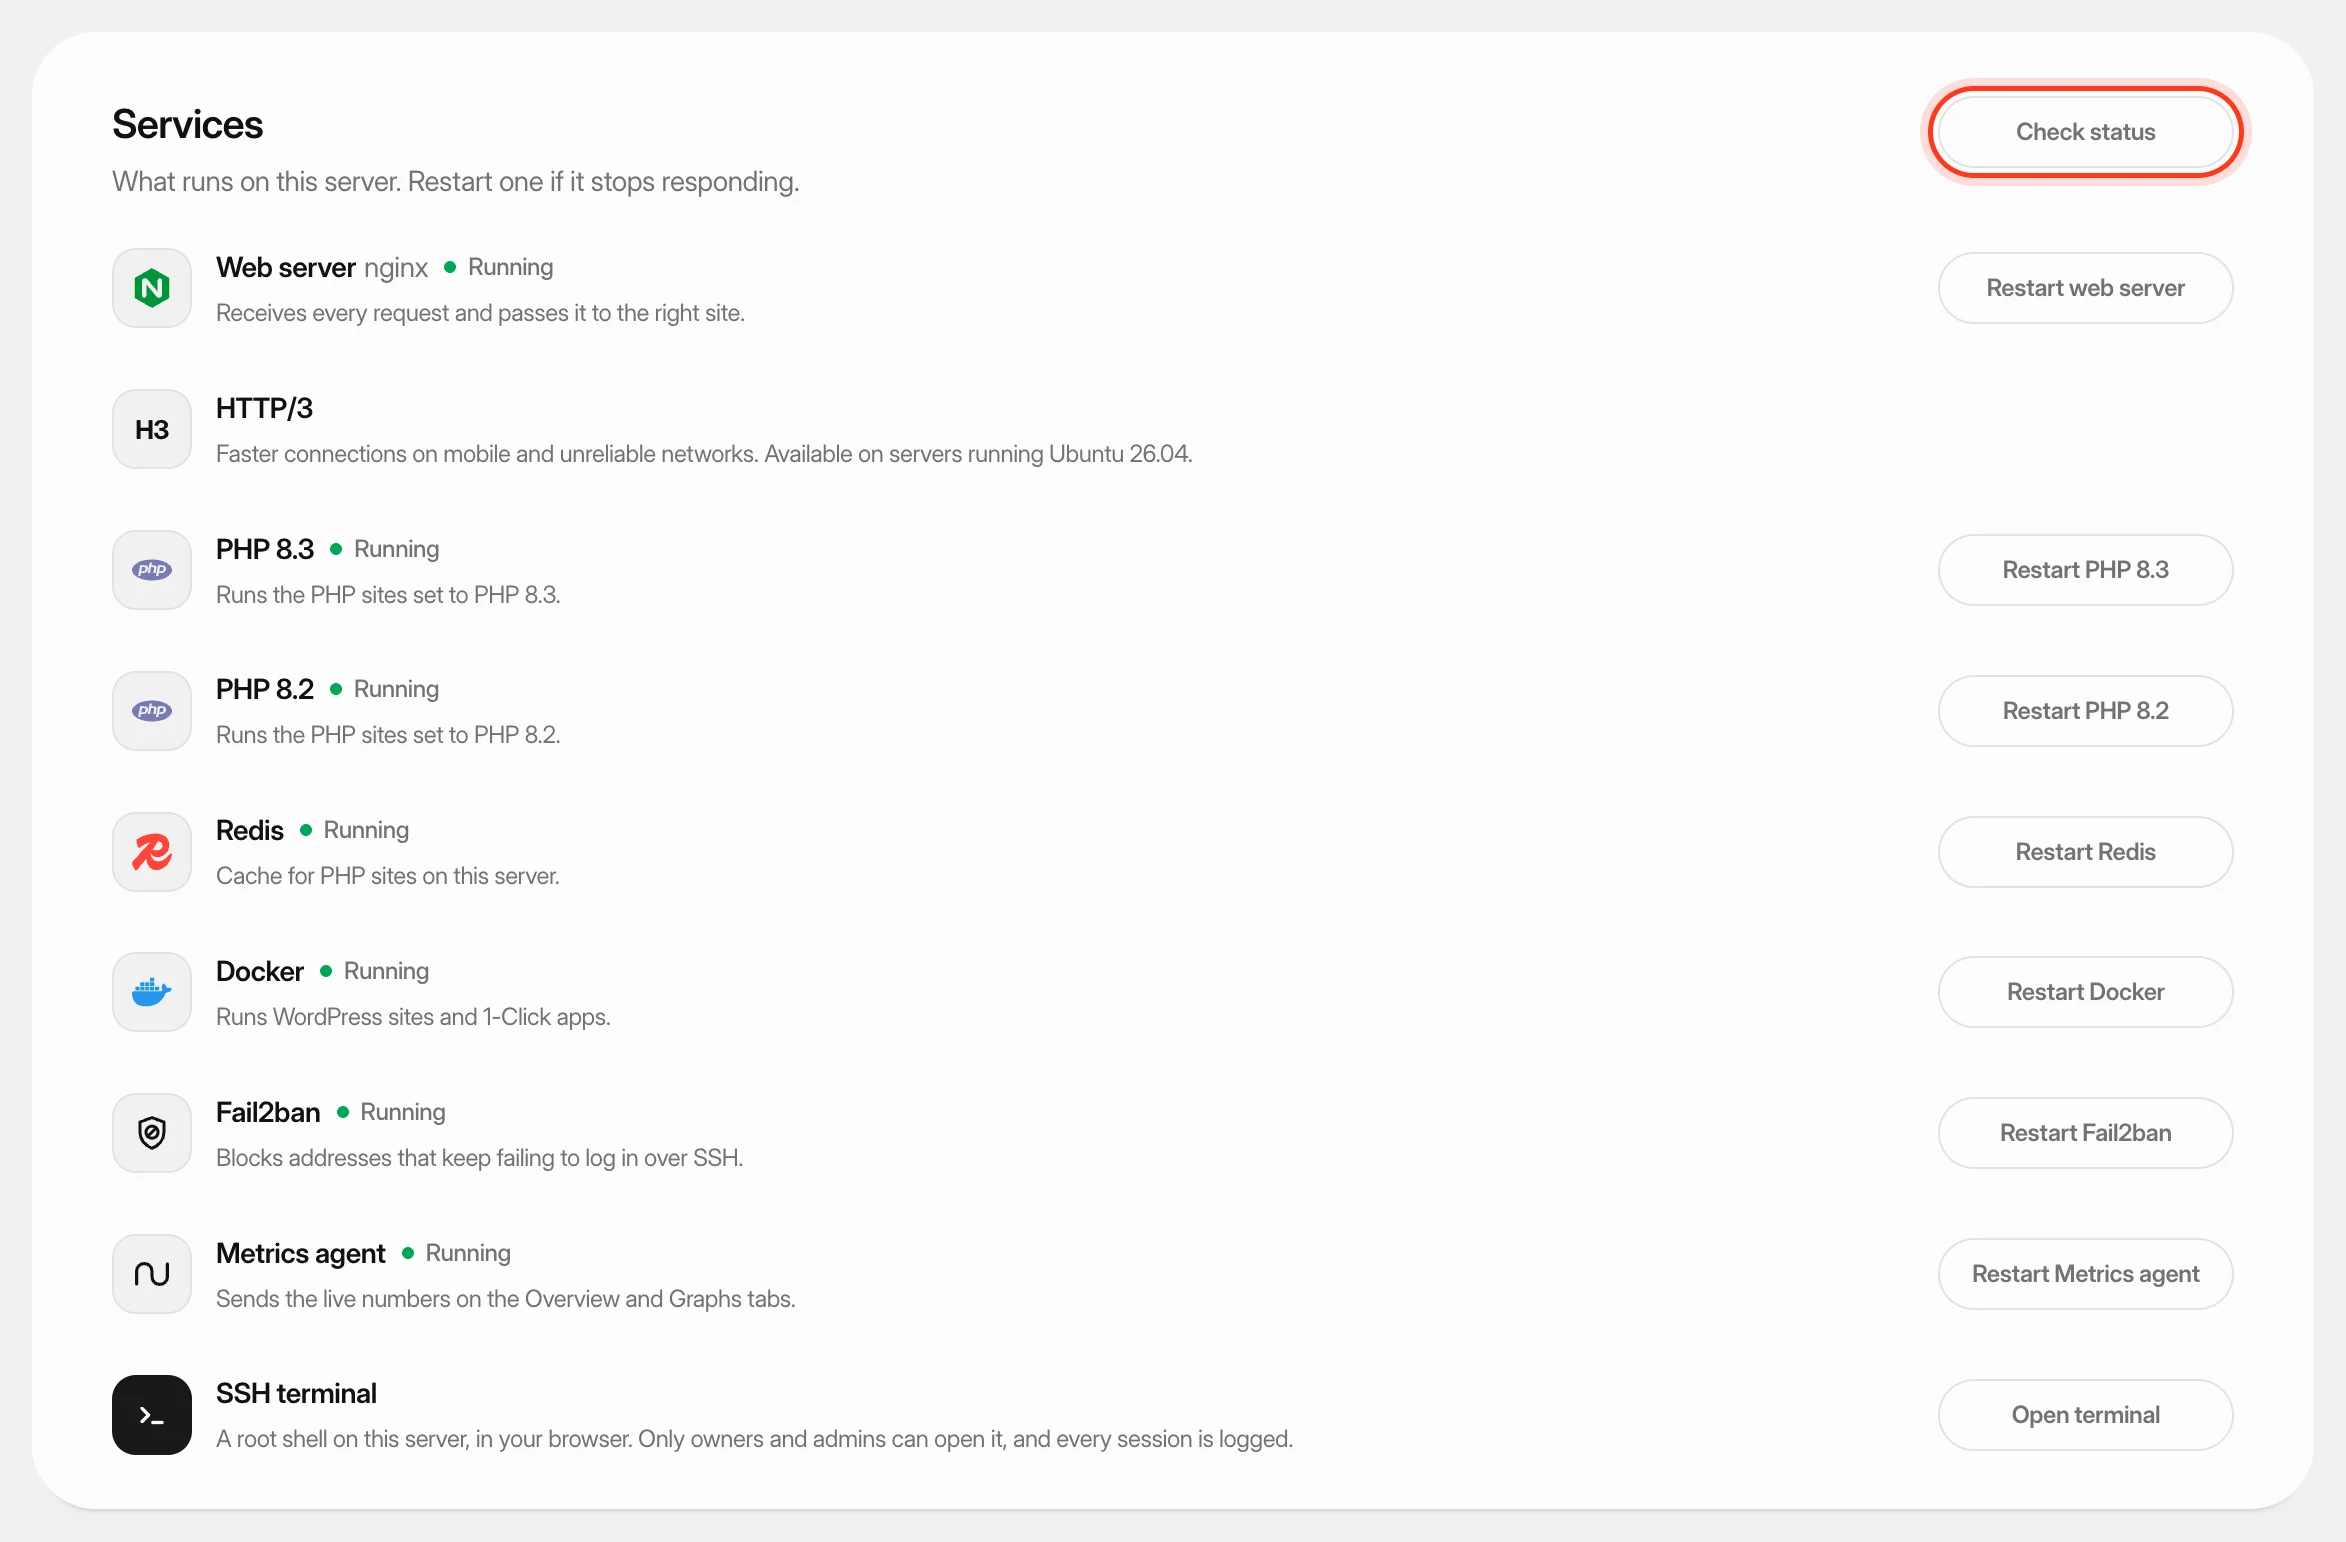 Check and restart server servicesSee which services run on your server, restart one that stopped responding, and turn HTTP/3 on or off.