Read your server page
Find a server, check whether it's healthy, and know where each setting lives on its page.
On this page
Step 1 Find the server
Open Servers. The line under the title counts your servers and how many are running, stopped or being set up. Use Search servers…, the provider filter and the status filter to narrow the list, and switch between grid and list view.
In grid view, each card shows live CPU, Memory and Disk use. Last reported readings means the server sent no new numbers in the last 2 minutes; Waiting for readings means it hasn't reported yet.
| Status | Meaning |
|---|---|
| Running | The server is set up and Nuvlo can manage it. |
| Provisioning | The server is still being set up. |
| Needs attention | Setup or a later check failed. Open the server to see what's wrong. |
| Offline | Nuvlo can't reach the server. |
Click a card, or open the row menu and choose Manage server.
Step 2 Check the header
The header shows the server's name, status, public IP address (with a copy button), provider and plan. Create site starts a new site on this server.
While a snapshot or backup is being restored, the status shows Restoring. If your account is over its Nuvlo plan, a notice says the server is paused: it keeps running, but Nuvlo no longer deploys to it, backs it up or changes it.
Step 3 See the sites on it
The Sites tab opens first. It lists every site on the server with its type, runtime and status. Use the icons to visit a site, redeploy it, or open its page.
Step 4 Check live usage
The Overview tab shows live CPU usage, Memory, Disk and Bandwidth. Live at the top right means the numbers are updating; click Refresh to read them again.
The strip below shows Uptime, Load average, the number of sites, and whether the Firewall is on. A load average above the server's vCPU count means it is overloaded.
Server details lists the provider, region, plan, IP address, status and creation date. Contabo servers also show the console password and subscription here, see Manage a Contabo server.
Step 5 Look at usage over time
The Graphs tab charts CPU, RAM, disk use, disk throughput, disk IOPS, network traffic and packets. Choose Live, 1 hour, 12 hours, 24 hours or 1 week.
If the charts are empty and Collecting historical metrics shows, click Refresh agent to reinstall the metrics agent. More in Monitoring.
Step 6 Open the other tabs
| Tab | What you do there |
|---|---|
| Firewall | Turn the firewall on and manage inbound rules. See Firewall rules. |
| Backups | Snapshots and the provider's automatic backups. Only shown when your provider offers them. See Server snapshots and Provider backups. |
| Settings | Maintenance, services, the server plan, runtimes, the WordPress database console, and disconnecting or deleting the server. |
Related guides
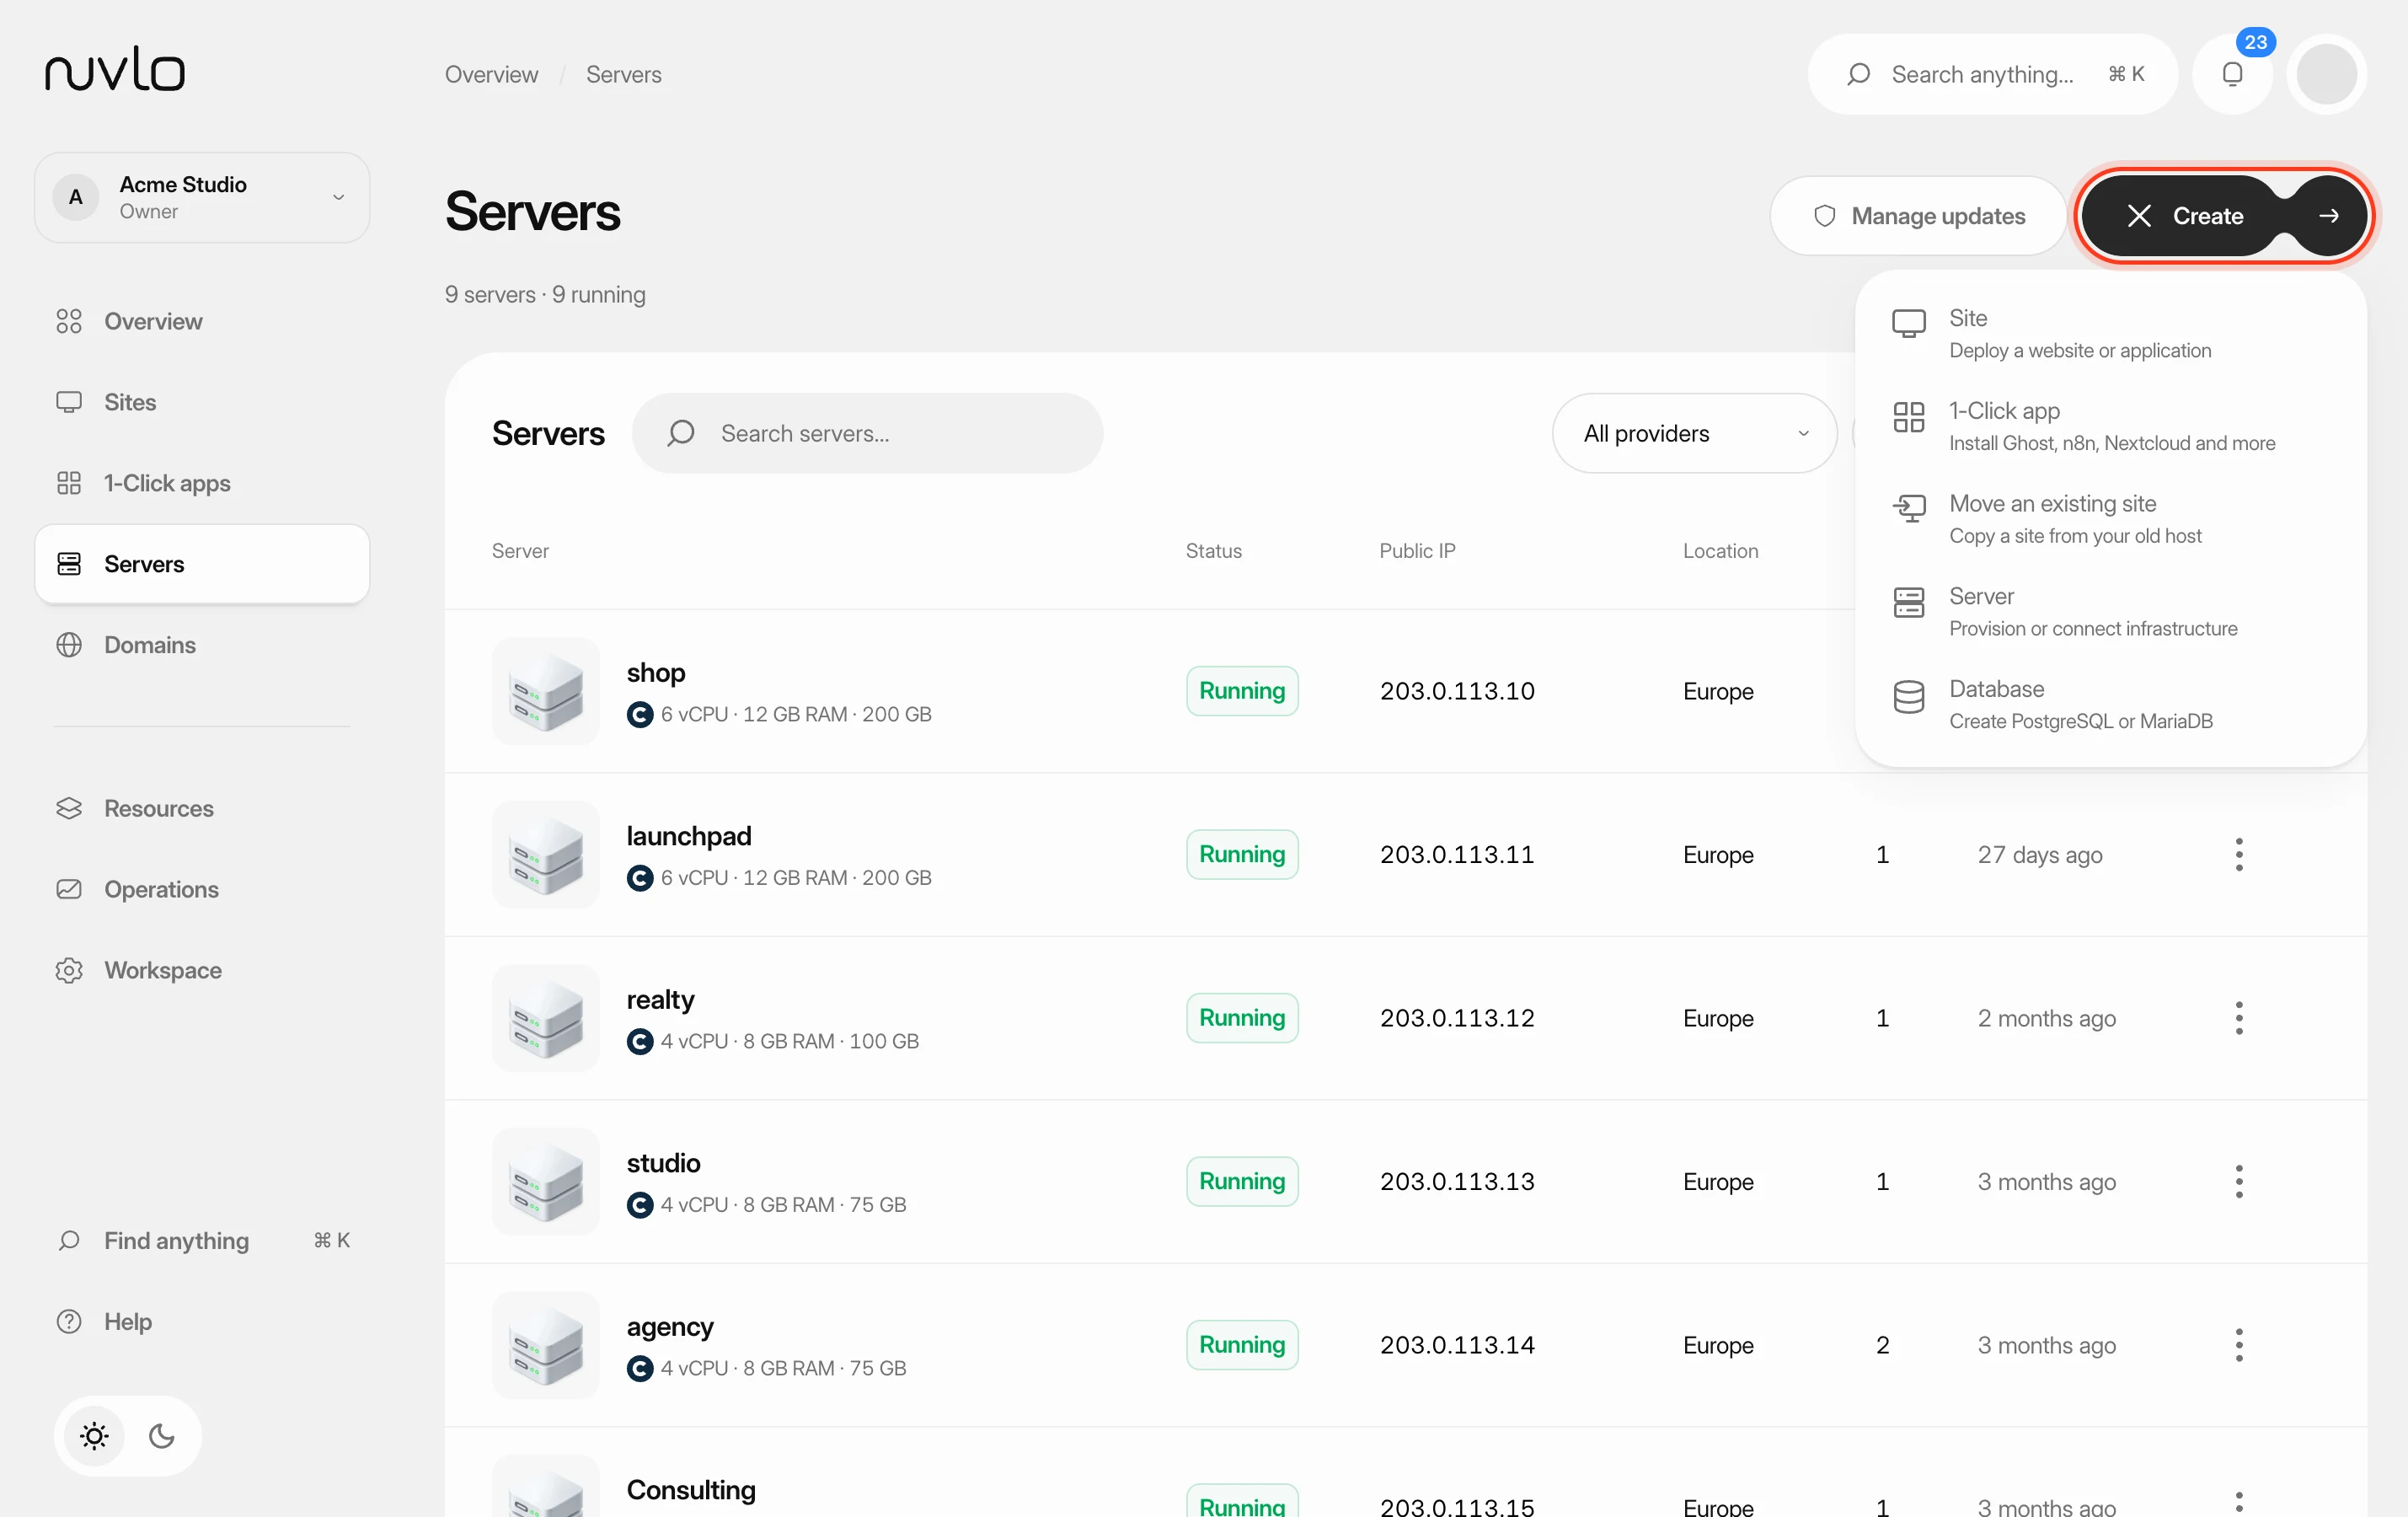 Create a serverOrder a new server at your cloud provider from Nuvlo and have it set up with everything your sites need: web server, firewall, security hardening and the software for the projects you plan to host.
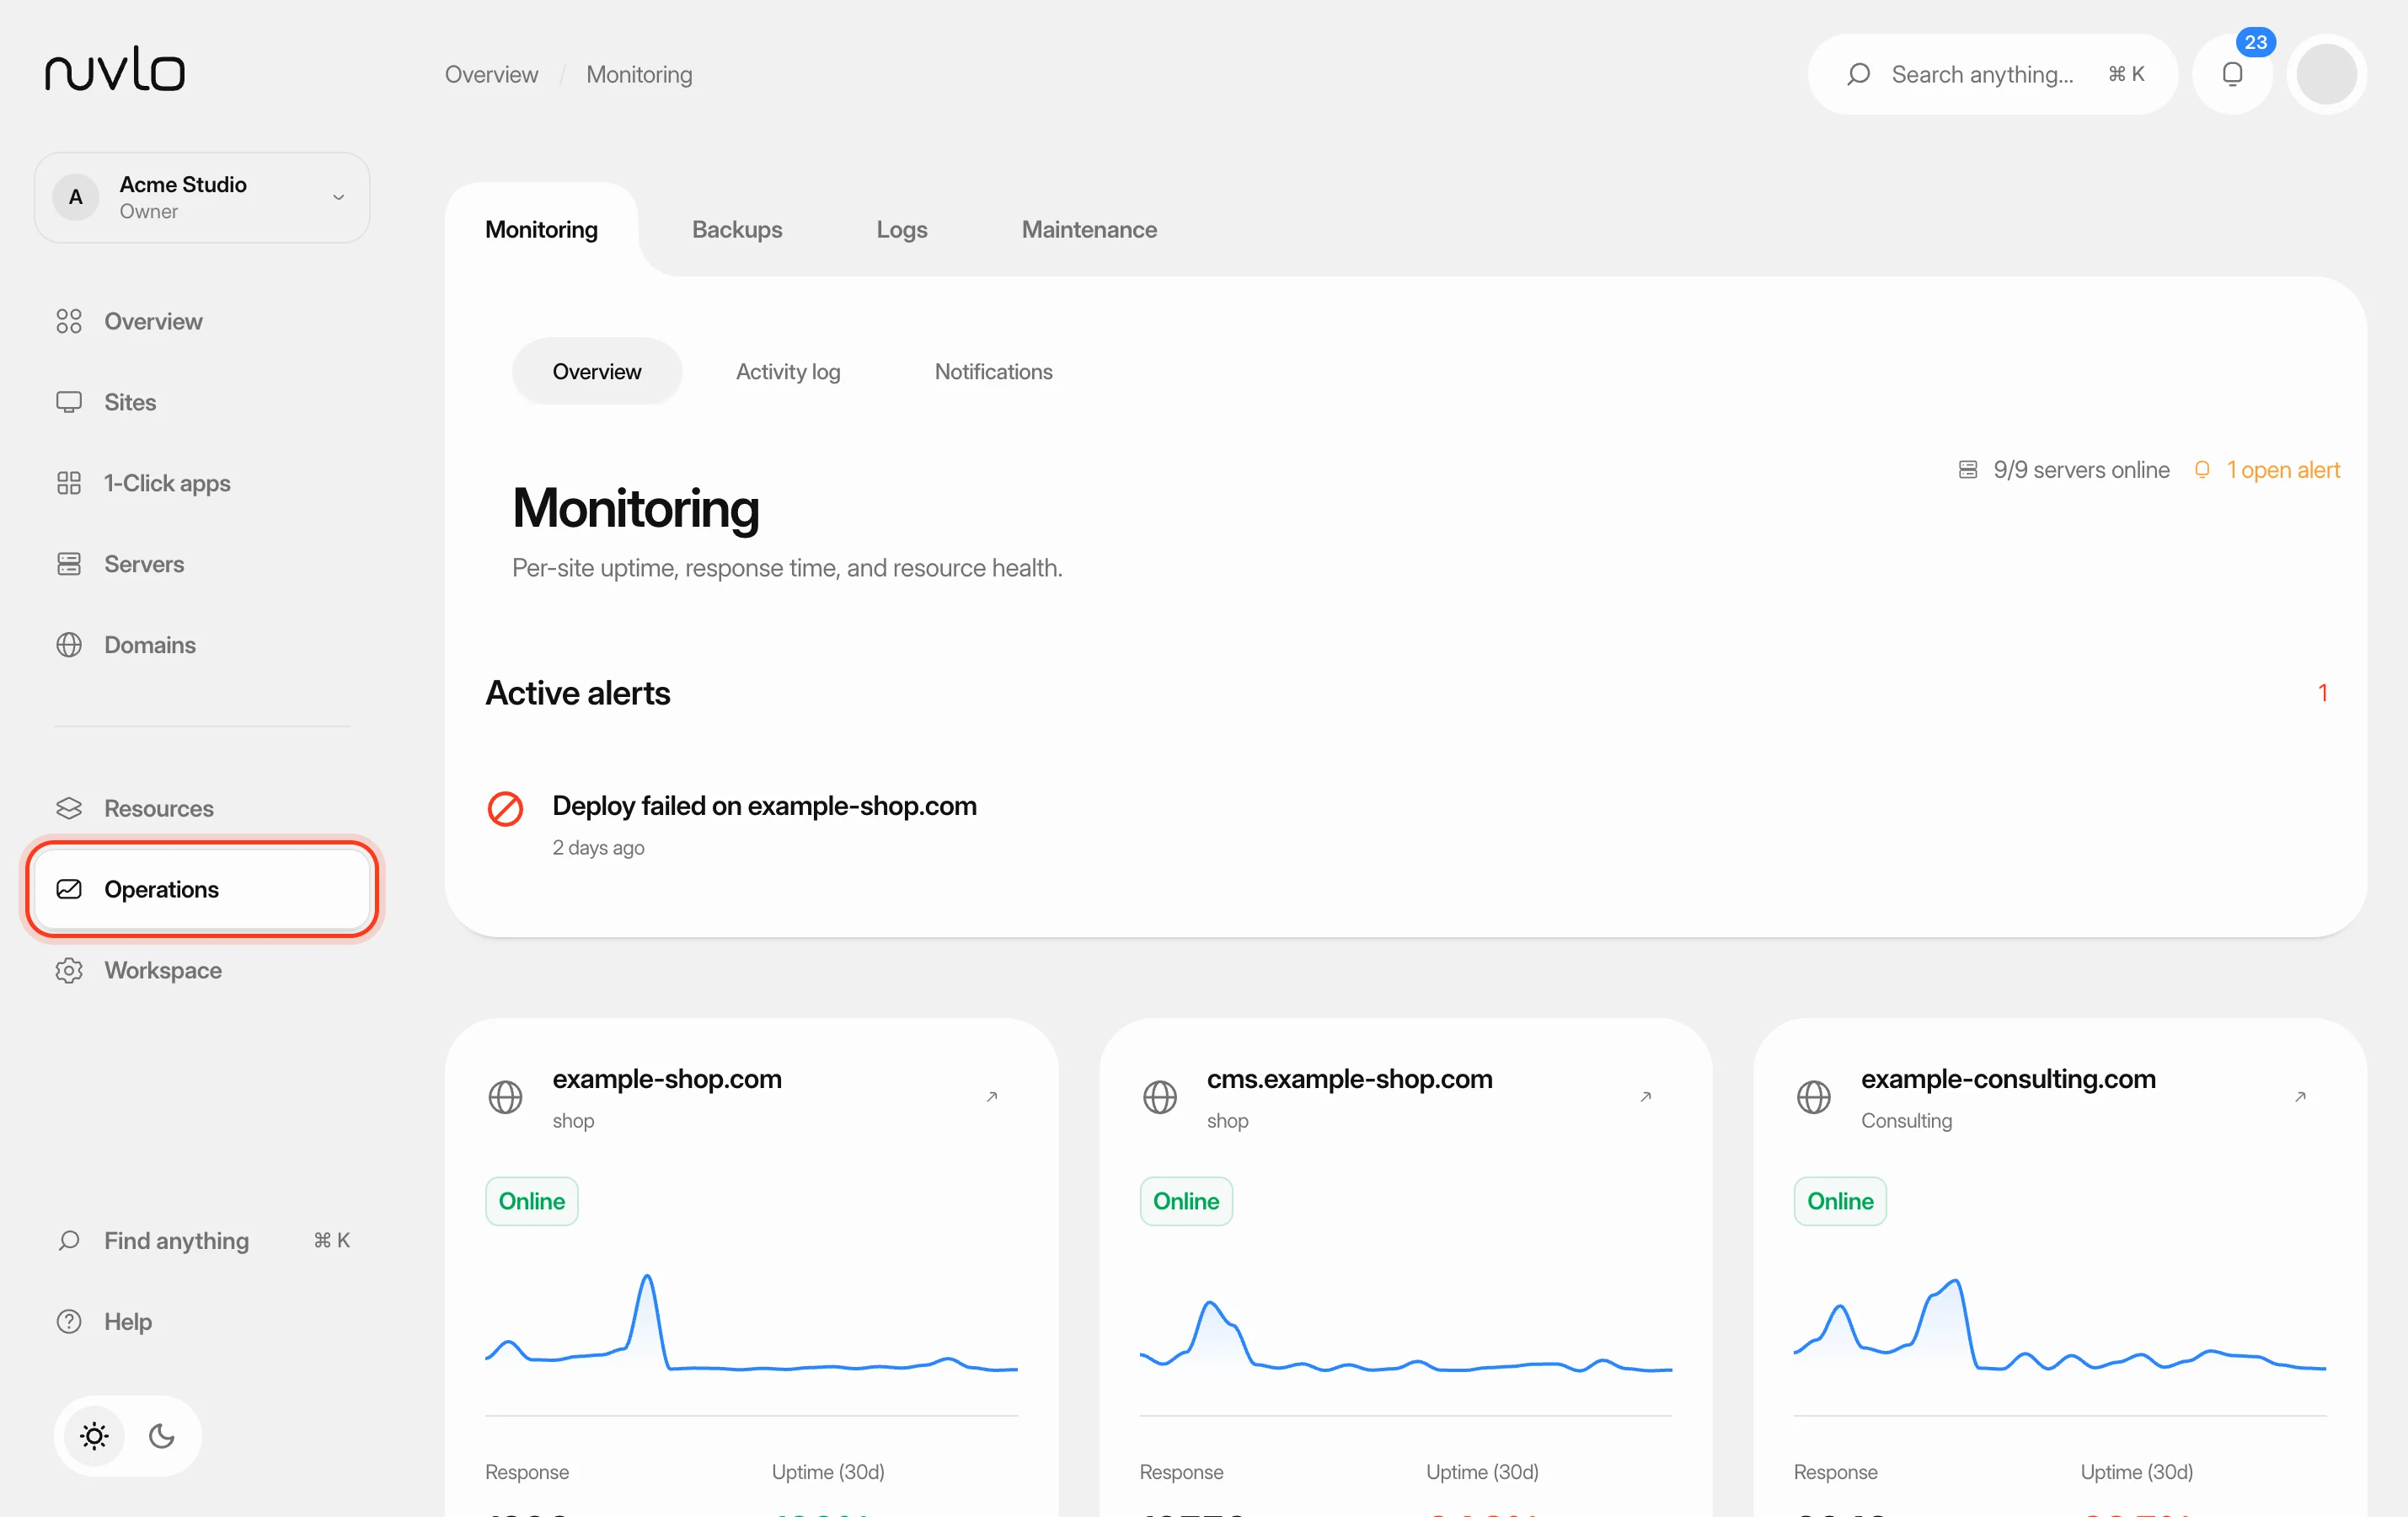 Monitor your sites and serversUse the Monitoring page to see which sites are up, how fast they answer and which problems need your attention, then drill into a single site or server.
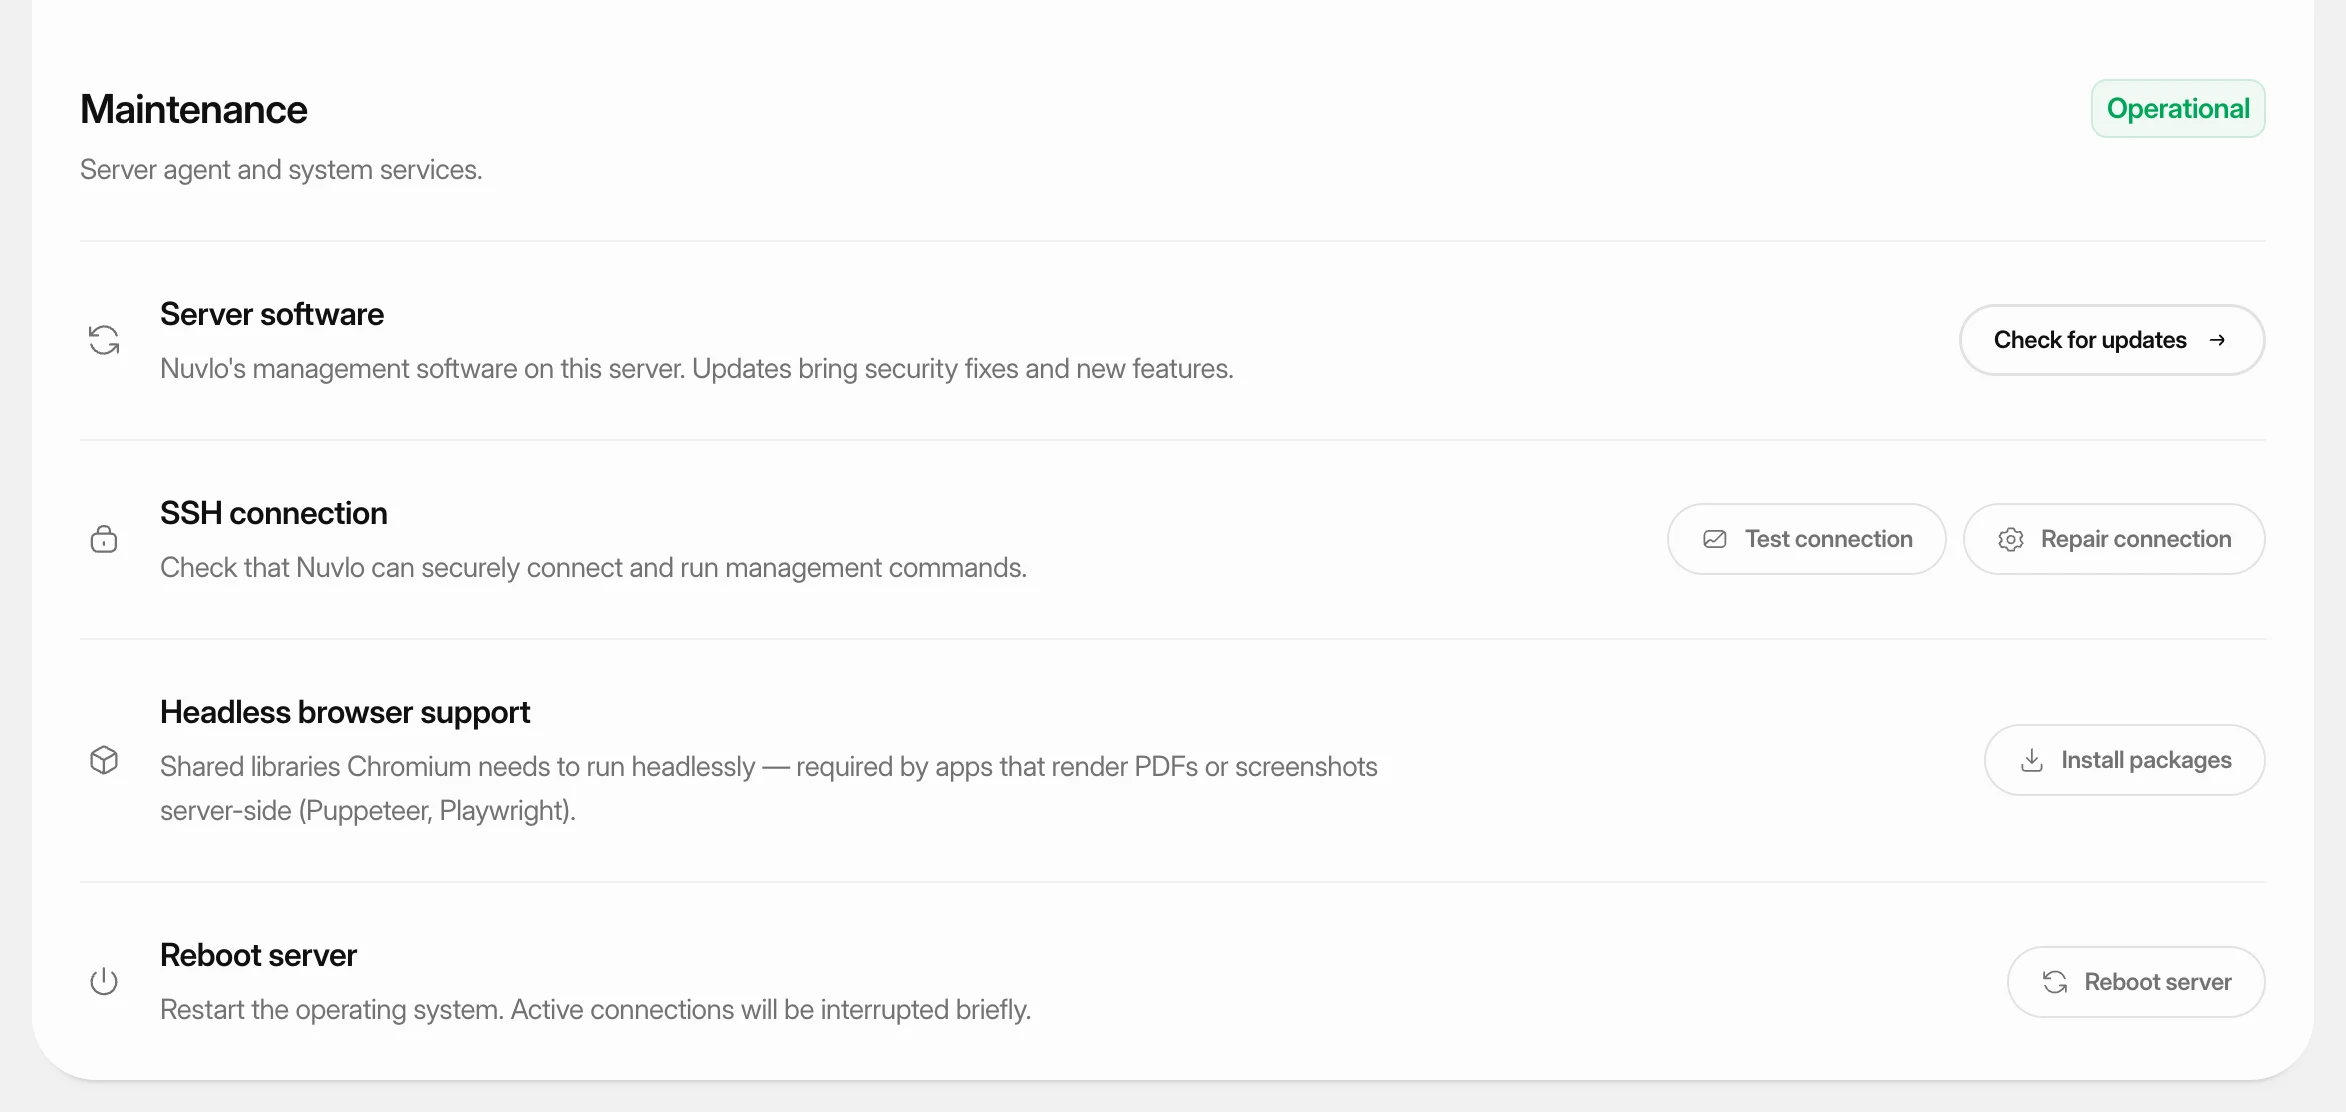 Test, repair and reboot a serverCheck that Nuvlo can still connect to a server, repair the connection, install extra system packages, and reboot the server safely.
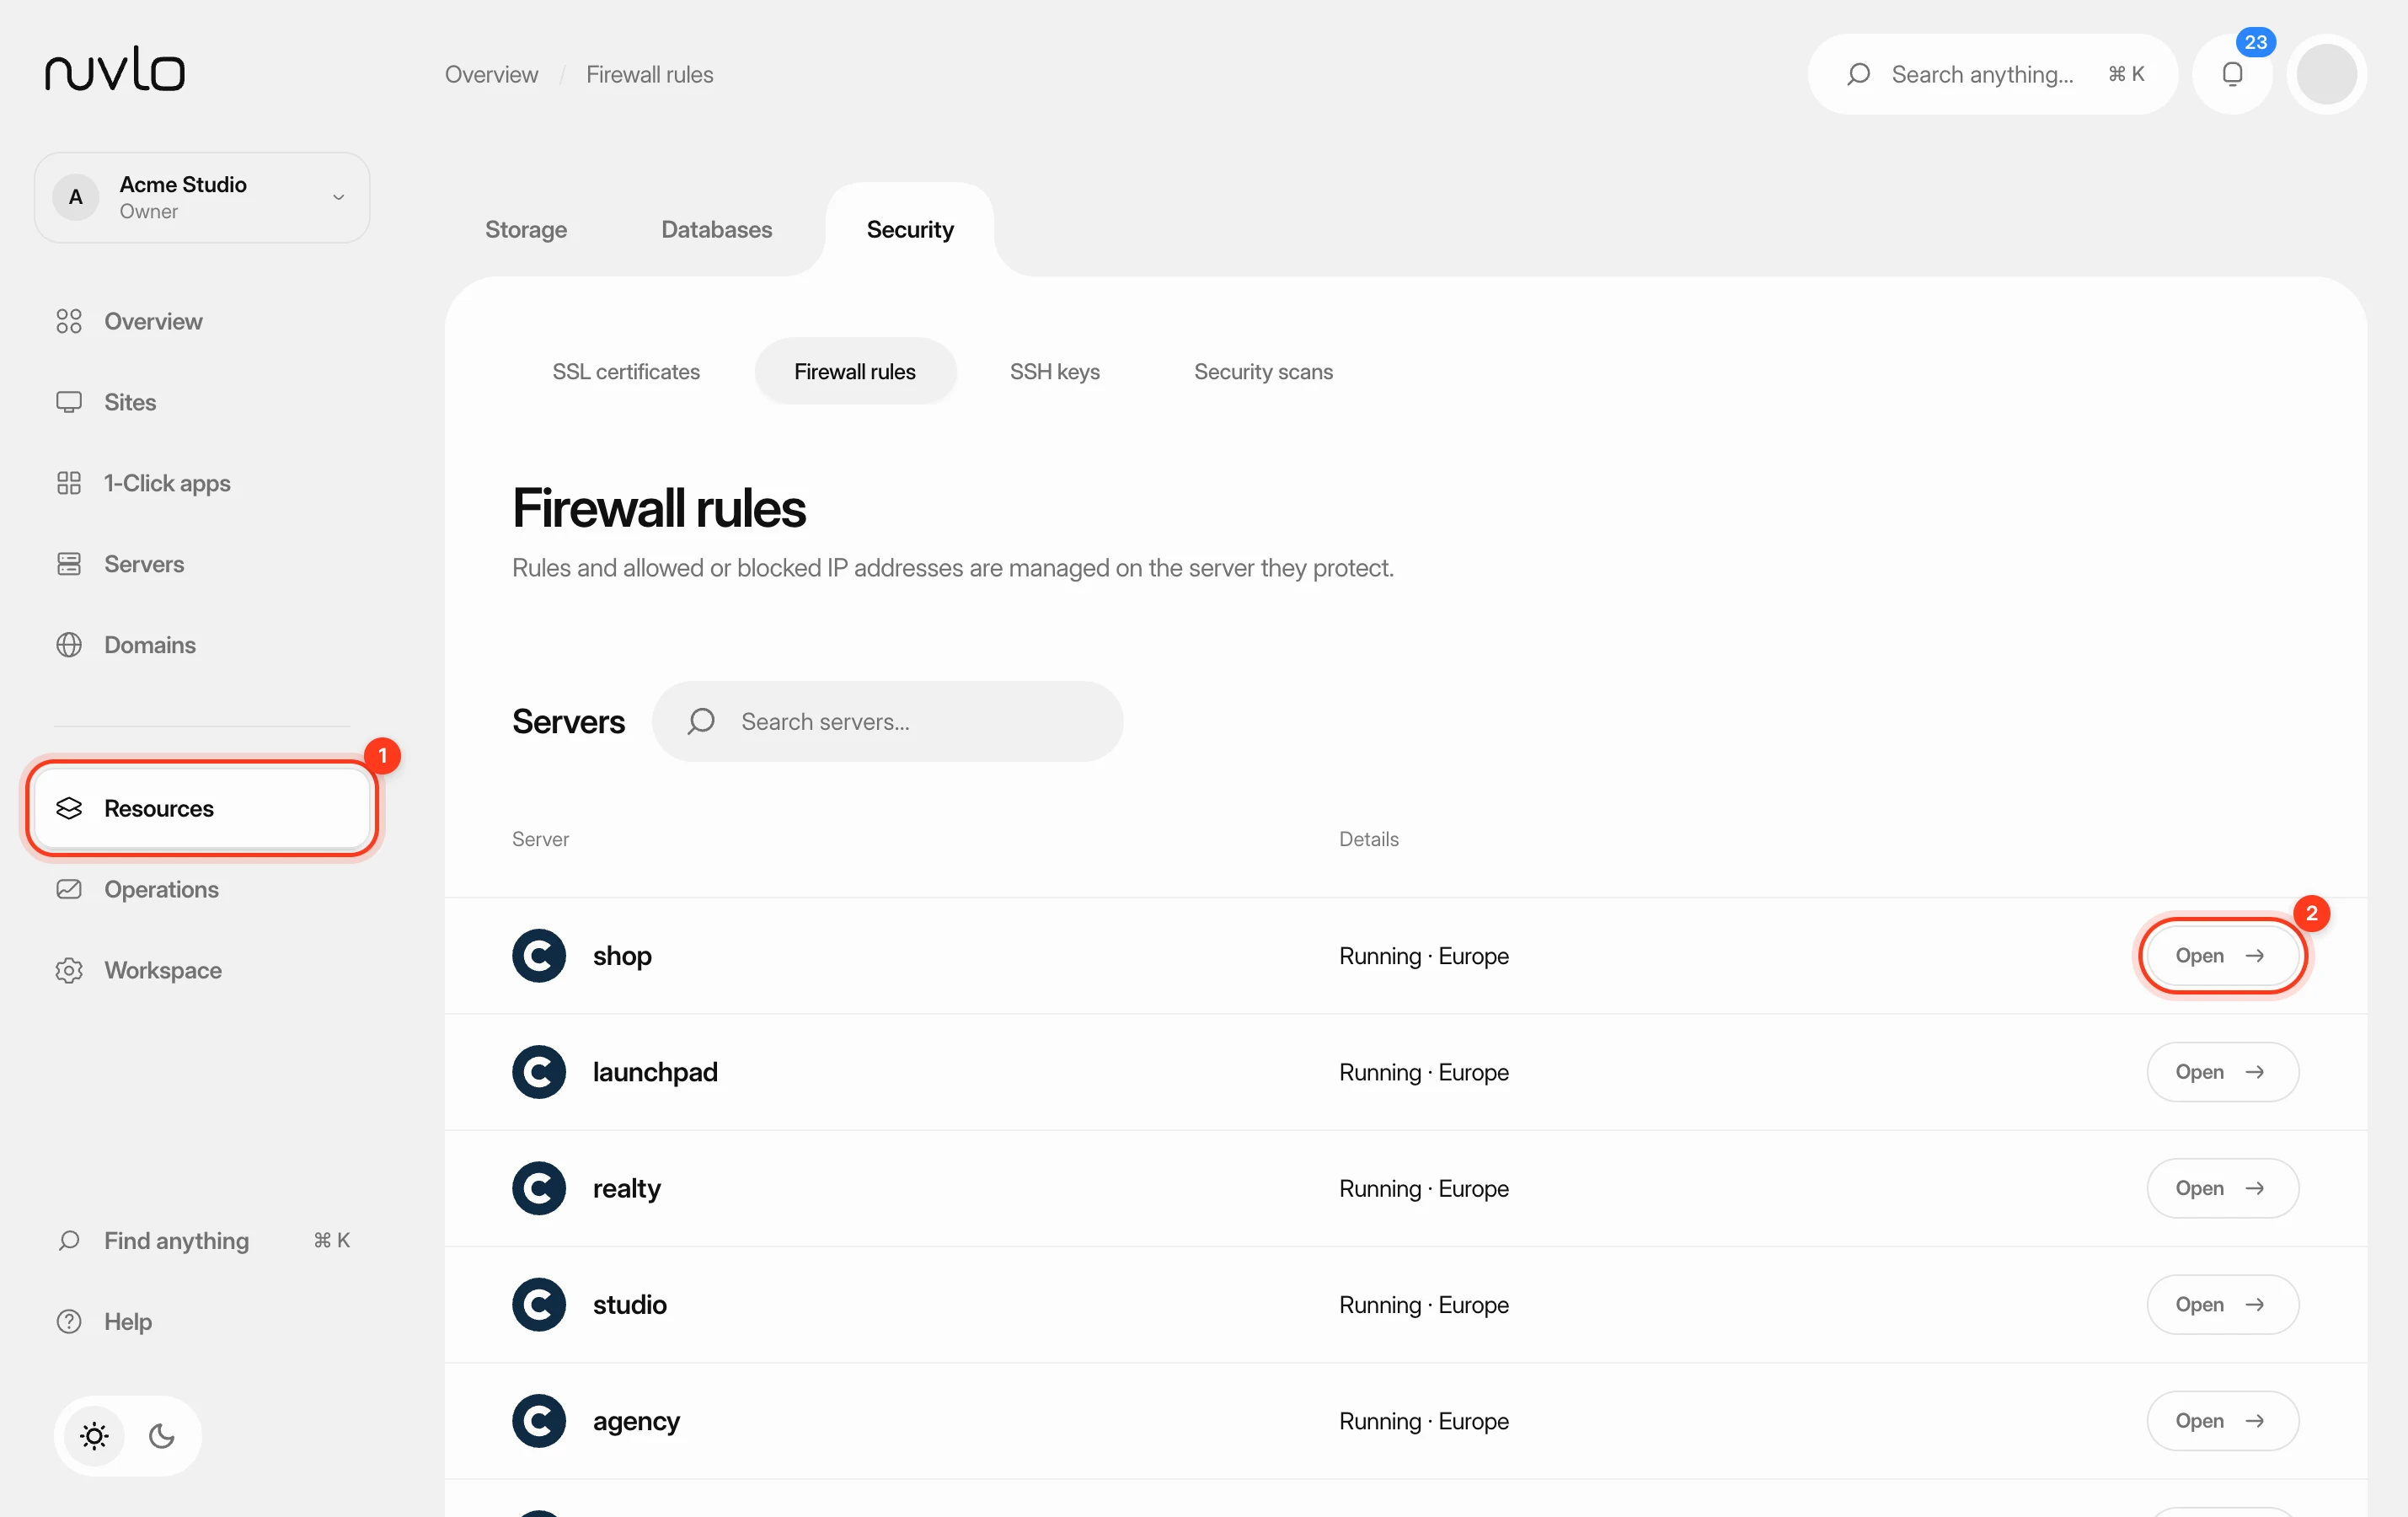 Set up firewall rulesTurn on the firewall of a server and decide which ports accept connections, and from which IP addresses. You can allow or block a port for everyone or for a single address or range.